

Abstract
Objective: Predictors of subclinical inflammatory obesity (SIO) can be important tools for early therapeutic interventions in obesity-related comorbidities. Waist circumference (WC) and BMI have different SIO sensitivity. We aimed to i) identify SIO predictors and ii) investigate whether CD16+ monocytes are associated with BMI- (generally) or WC-defined (centrally) obesity. Methods: Anthropometric and metabolic/endocrine (namely catecholamines, adrenaline and noradrenaline) parameters were evaluated, and CD16+ monocytes were studied by flow cytometry in the peripheral blood from 63 blood donors, and compared and correlated to each other. Multiple linear regression analysis was performed to identify variables that best predict SIO. Results: CD16+ monocyte counts were similar in BMI and WC groups. CD16+ monocytes from centrally obese (CO) showed a more inflammatory pattern, as compared to non-CO subjects. WC was sensitive to lipidemia and, in CO subjects, lipidemia was associated with a more inflammatory phenotype of CD16+ monocytes. These differences were not noticed between BMI groups. Adrenaline was correlated with CD16+ monocyte expansion with a lower inflammatory pattern. Leptin, very low-density lipoprotein cholesterol (VLDL-C), and CD14 expression of CD16+ monocytes were found to be CO predictors. Conclusions: WC-, but not BMI-defined obesity, was associated with a more inflammatory pattern of CD16+ monocytes, without monocyte expansion, suggesting that a monocyte maturation process rather than an independent arise of CD16+ monocytes occurs in CO. Thus, in a population with low cardiovascular risk, leptin, VLDL-C, and CD14 expression of CD16+ monocytes predict CO, constituting a putative tool for screening of SIO.
Introduction
Obesity is a major threat to human health and lifespan. In the pathogenesis of obesity and its comorbidities, increasing evidence points to a pivotal role of the crosstalk between metabolic and immune systems, with adipocytes exhibiting immune functions and immune cells being influenced by endogenous metabolites, namely lipids [1,2]. Obesity induces macrophage infiltration into white adipose tissue (AT) in both humans [3] and mice [4], orchestrating local and systemic inflammation, and consequently leading to insulin resistance, type 2 diabetes, and cardiovascular disease (CVD). The recruitment of circulating monocytes into the AT is an early event in obesity-induced AT inflammation [1]. Although monocyte counts have a strong and independent relationship with the overall cardiovascular risk [5], the role of the distinct circulating monocyte subsets in obesity is still undetermined.
Even though inflammation remains a key mechanism underlying this pathophysiology, finding sensitive tools towards the identification of subclinical inflammatory obesity (SIO) is challenging. In the context of our study, SIO is defined as the presence of inflammatory markers in a healthy population without obesity-associated metabolic disease or CVD [6]. Discovery of biomarkers to allow earlier detection of inflammatory obesity will help to assess therapeutic effectiveness for obesity-related comorbidities such as CVD and cancer, which are increasing in incidence worldwide [7].
BMI is the most used and widely accepted method in epidemiological studies to measure obesity [8]. However, BMI neither indicates fat distribution nor does distinguish fat mass from fat-free mass, which have opposite associations with health risk [8]. In contrast, waist circumference (WC), a measure of central adiposity, has been found to be highly correlated with visceral fat measured by computed tomography [9] and better estimates obesity-associated cardiovascular risk in comparison to BMI [9]. Obesity, mainly the central type, is associated with both a chronic inflammatory state and sympathetic nervous system over-activity [1,10]. The catecholamines (CA) adrenaline (AD) and noradrenaline (NA), potent modulators of neuroendocrine/immune/inflammatory networks, regulate monocyte inflammatory response during health and disease [11]. The crosstalk between adipokines and CA suggests a role for these molecules linking obesity to inflammation [12]. Among immune cells, monocytes are key players in obesity-associated systemic inflammatory processes and in the development of CVD [1]. In obesity, visceral AT becomes infiltrated by a large number of monocytes mainly originated from the peripheral blood [4]. Two major peripheral blood monocyte subsets have been described, according to their immunophenotype: classical CD14+ CD16- (CD16-) and non-classical CD14+ CD16+ (CD16+) subsets [13]. CD16+ monocytes have also been shown to have lower expression of both CD11b (integrin alpha M or complement receptor type 3), and CD36 (fatty acid translocase, a scavenger receptor), as compared to CD16- monocytes, and they are considered ‘pro-inflammatory' cells since they exhibit a macrophage-like phenotype with enhanced antigen-presenting capacities, higher endothelial affinity, and production of pro-inflammatory cytokines [13,14]. Accordingly, increased percentages and/or absolute numbers of CD16+ monocytes have been described in the peripheral blood from patients with inflammatory pathologies, such as sepsis, rheumatoid arthritis, and infections [13], and in patients with a high cardiovascular mortality risk [15]. Rogacev et al. [16] described a weak association between CD16+ monocyte counts and BMI in a healthy population. However, the pathophysiological significance of these findings is still controversial. Moreover, in inflammatory obesity, it is uncertain whether there is an expansion of CD16+ cells or a maturation process from classical to non-classical monocytes and if CA (AD and NA) are associated with monocyte characteristics observed in that condition. Previously, we have demonstrated that central obesity (CO) is associated with a higher immune inflammatory pattern and a downregulation of dopaminergic pathways in peripheral blood mononuclear cells [17].
The main aims of our study were i) to identify predictors of SIO, ii) to investigate whether pro-inflammatory CD16+ monocytes are preferentially associated with BMI-defined or WC-defined obesity, and iii) to evaluate which anthropometric, metabolic or endocrine parameters are associated with CD16+ monocyte characteristics.
Our work, for the first time, addresses the prediction of SIO, a major issue in public health given its comorbidities associated with a decrease in human lifespan.
Material and Methods
Study Population
This study was conducted in 65 blood donors from the Blood Bank of Clinical Hematology Department of Centro Hospitalar of Porto (CHP), Portugal; it meets the standards of the Declaration of Helsinki in its revised version of 1975 and its amendments of 1983, 1989, and 1996 and was approved by the Ethical Committee and Research Office, and authorized by the administration board of CHP, being registered with the identifier 072/09 (047-DEFI/065-CES). All participants signed a written informed consent, after being ware informed the objectives of the study and the confidentiality of the data. The individuals met the selection criteria for blood donation and were not under any medicines during the previous month. Two blood donors that were not fasting for at least 12 h at the time of blood withdrawal were finally excluded. After 5 min of rest, blood pressure (systolic blood pressure (SBP) and diastolic blood pressure (DBP)) was measured twice, and the mean values were used in the analysis.
Anthropometrics
Height (in meters) was based on an identification document and confirmed by medical record. Body weight was measured to the nearest 100 g on electronic weight scales. BMI was calculated by dividing weight by squared height and expressed in kg/m2. Participants, all Caucasian, were divided into three BMI categories that correspond to the definitions of normal weight (NW; BMI 18.5-24.9 kg/m2), overweight (OW; BMI 25.0-29.9 kg/m2), and obesity (OB; BMI ≥ 30.0 kg/m2), according to the World Health Organization (WHO) guidelines [8]. WC was measured with a flexible tape at the level midway between the lowest rib margin and the iliac crest. As stated by the International Diabetes Federation, CO was defined as WC ≥ 0.80 m in women and WC ≥0.94 m in men [18].
Biochemical Analysis
Blood samples were taken from all subjects under standardized conditions. Fasting plasma glucose, triacylglycerol (TAG), total cholesterol (TC), high-density lipoprotein-cholesterol (HDL-C), low-density lipoprotein cholesterol (LDL-C), and very low-density lipoprotein cholesterol (VLDL-C) were measured with turbidometry and spectrophotometry methodology using the Cobas® 8000 autoanalyzer (Roche Diagnostics International Ltd, Rotkreuz, Switzerland). Glycosylated hemoglobin (HbA1c) measurements were done by high performance liquid chromatography (HPLC), using the Hi-Auto A1c HA-8140 HPLC (Menarini Diagnostics, Florence, Italy). Plasma CA (NA and AD) were determined by HPLC with electrochemical detection (HPLC-ED) (Chromosystems Instruments & Chemicals GmbH, Munich, Germany). Determination of cortisol in plasma was performed with an electrochemiluminescence immunoassay (Elecsys Systems analyzer Roche; Roche Diagnostics International Ltd). Leptin levels were measured in serum by solid-phase two-site enzyme immunoassay (Mercodia Leptin ELISA; Mercodia AB, Uppsala, Sweden). High-sensitivity C-reactive protein (hsCRP) (mg/l) was determined by nephelometry (CardioPhase™ hsCRP - BnProSpe;c Siemens Healthcare Diagnostics Inc. New York, NY, USA) and categorized by cardiovascular event risk groups: <1 = low, ≥1 to <3 = intermediate, and >3 = high risk, as described before [19].
Flow Cytometry Assay of Monocytes
Monocytes were analyzed in fresh ethylenediaminetetraacetic acid tripotassium (EDTA-K3) anticoagulated blood samples by means of flow cytometry using a previously described technique [20]. The enumeration and the immunophenotypic analysis of monocytes were performed. Immunophenotypic studies were done through a whole blood stain-lyse-and-then-wash method and a direct immunofluorescence technique using the following a four-color panel of monoclonal antibodies (mAbs): mouse anti-human CD36 conjugated with fluorescein isothiocyanate (FITC) (clone FA6.152, IgG1), mouse anti-human CD16 conjugated with phycoerythrin (PE) (clone 3G8, IgG1), and mouse anti-human CD14 conjugated with PE-Cy5 (IgG2a, clone RMO52), all obtained from Beckman Coulter (Brea, CA, USA; catalogue numbers IM0766U, IM1238U and IM2640U, respectively), as well as mouse anti-human CD11b conjugated with allophycocyanin (APC) (IgG2a, clone D12), obtained from Becton Dickinson (BD) (Franklin Lakes, NJ, USA; catalogue number 333143). Data acquisition was carried out on a FACSCalibur flow cytometer (BD), using the Cell Quest software program (BD). Information on a minimum of 2 × 10⁵ events was acquired for each staining and stored as FCS data. The Paint-a-Gate Pro software program (BD) was used for data analysis. Monocytes were quantified based on the CD14 expression, while CD16 was used to differentiate classical (CD16-) and non-classical (CD16+) monocyte populations (fig. 1). The median fluorescence intensity (MFI) of CD14, CD36 and CD11b was assessed in each subset and expressed as fluorescence arbitrary units (AU). The forward light scatter (FSC), which is related to cell size, and the sideward light scatter (SSC), which correlates with cell complexity/granularity, were also measured. The ratio of CD14+ CD16+ non-classical monocytes and CD14+ CD16- classical monocytes for each parameter in each individual was calculated to overcome inter-individual variations.
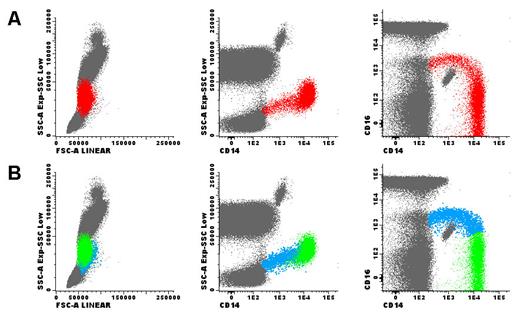
Total monocytes (red dots) were selected in the SSC versus CD14 dot plot, based on the expression of CD14 (panel A). Afterwards, classical CD14+ CD16- monocytes (green dots) and pro-inflammatory CD14+ CD16+ monocytes (blue dots) were identified in the CD16 vs. CD14 dot plot, based on the expression of CD14 and CD16 (panel B). Subsequently, these two monocyte populations were gated and separately analyzed for the levels of CD11b, CD14 and CD36 expression, using theMFI obtained for each marker; the FSC and SSC were also measured. Finally, the ratio between the values obtained on CD14+ CD16+ and CD14+ CD16- monocytes was calculated, for each parameter and in each individual. CD14 and CD16 positivity were defined using fluorescence minus one controls. Other leukocytes are represented as gray dots. Dot plots showed in this figure were obtained using the Infinicyt software (Cytognos).
Total monocytes (red dots) were selected in the SSC versus CD14 dot plot, based on the expression of CD14 (panel A). Afterwards, classical CD14+ CD16- monocytes (green dots) and pro-inflammatory CD14+ CD16+ monocytes (blue dots) were identified in the CD16 vs. CD14 dot plot, based on the expression of CD14 and CD16 (panel B). Subsequently, these two monocyte populations were gated and separately analyzed for the levels of CD11b, CD14 and CD36 expression, using theMFI obtained for each marker; the FSC and SSC were also measured. Finally, the ratio between the values obtained on CD14+ CD16+ and CD14+ CD16- monocytes was calculated, for each parameter and in each individual. CD14 and CD16 positivity were defined using fluorescence minus one controls. Other leukocytes are represented as gray dots. Dot plots showed in this figure were obtained using the Infinicyt software (Cytognos).
Instrument setup, calibration, and daily monitoring were performed with the protocols in use in our laboratory at the time of the study. Briefly, for instrument setup and calibration, unstained cells (autofluorescence controls) were used to adjust FSC and SSC detector settings so that cells of interest were displayed on scale. Next, also using unstained cells and gating on lymphocytes, FL1, FL2, FL3 and FL4 detector settings were adjusted so that autofluorescence background was roughly within the first decade of the log scale of the respective fluorescence histogram. Subsequently, electronic compensation was performed by running cell samples stained individually with FITC-, PE-, PE-Cy5- and APC-conjugated anti-CD8 mAbs (single stains). Finally, compensation was checked by running cell samples stained simultaneously with FITC-, PE-, -PE-Cy5- and APC-conjugated mAbs staining mutually exclusive cell populations. Daily control was performed using Calibrite beads and monitored by plotting MFI values in Levy Jennings charts.
Blood Cell Counts
Blood cell counts were obtained using a Coulter LH750 automated hematology analyzer (Beckman Coulter). Absolute counts of total, CD16- and CD16+ peripheral blood monocytes, expressed as numbers of cells/μl, were calculated using a dual-platform method in which total white blood cell counts were derived from the hematology analyzer and the correspondent percentages of monocytes were obtained by flow cytometry.
Statistical Analysis
The modified Kolmogorov-Smirnov test with the correction of Lilliefors was used to evaluate the fit of the data to a normal distribution. Variables were summarized using relative and absolute frequencies, mean and standard deviation, and median (interquartile range (25th and 75th percentiles). To compare the quantitative independent variables, we used bivariate statistical analysis ANOVA with Bonferroni post hoc testing (comparisons between more than 2 groups) or non-parametric Mann-Whitney (comparison between 2 groups) and Kruskal-Wallis (comparison of more than 2 groups) tests for normal and non-normal distributed data, respectively. Correlations were assessed by non-parametric Spearman rank analysis. Pearson's chi-square test was used to compare the distribution of qualitative independent variables. Multiple linear regression analysis was performed to identify the variables that best predict CO after controlling for potential confounders. Linear regression models require only two subjects per variable for adequate estimation of regression coefficients, standard errors, and confidence intervals [21]. Variables that in the univariate analysis showed statistical significance below 5% (p < 0.05) were included in the regression. Data analysis was performed using the SPSS version 22.0 (IBM Analytics, New York, NY, USA). A p value lower than 0.05 was considered statistically significant.
Results
Baseline Characteristics and Anthropometrics, Metabolic/Endocrine Parameters and hsCRP in BMI and WC Groups
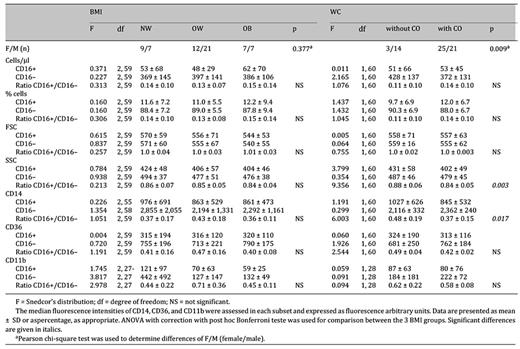
The baseline characteristics of the study sample are shown in table 1. The mean ages (years) of the individuals in the three BMI ((normal weight = 38 ± 11 vs. overweight = 40 ± 11 vs. obesity = 44 ± 11 years, F (2, 60) = 1.199, p = 0.309) and in the two CO groups (with CO = 42 ± 10 vs. without CO = 36 ± 11 years, F (1, 61) = 3.855, p = 0.054) were similar. 55.6% of the participants were male. The prevalence of BMI-defined overweight/obesity and of WC-defined CO was 75% and 73%, respectively. DBP (obesity = 89 ± 9 vs. overweight = 80 ± 9 vs. normal weight 73 ± 8 mm Hg, F (2, 60) = 12.748, p < 0.001) and leptin plasma levels (obesity = 1.17 (0.85-3.47) vs. overweight = 0.50 (0.30-1.05) vs. normal weight = 0.20 (0.04-0.63) ng/ml, p = 0.002) were significantly higher in the obesity group than in both overweight and normal-weight participants, . Mean DBP in overweight participants was also higher than in normal-weight subjects (p = 0.025). Obese individuals also presented higher SBP than normal-weight subjects ((44 ± 16 vs. (129 ± 16 mm Hg, F (2, 60) = 4.413, p = 0.016). Subjects with CO in comparison with those without CO had not only higher DBP (82 ± 11 vs. 76 ± 7 mm Hg, F (1, 61) = 4.244, p = 0.044) and leptin levels (0.870 (0.510-1.300) vs. 0.100 (0.040-0.210) ng/ml, p = 0.006) but also showed differences in lipid profile. These include higher levels of TC (200 ± 35 vs. 178 ± 35, mg/dl, F (1, 59) = 4.978, p = 0.029), TAG (100 (68-135) vs, 78 (50-99) mg/dl, p = 0.034) and VLDL-C (20 (14-27) vs. 16 (10-20) mg/dl, p = 0.033). None of the other metabolic/endocrine parameters were significantly different between BMI and WC groups. The plasma levels of hsCRP (data as median and interquartile range (25th and 75th percentiles)) were neither different between BMI-defined (normal weight = 1.410 (0.352-1.920) vs. overweight = 1.190 (0.571-2.250) vs. obesity = 3.020 (1.090-3.860) mg/l, p = 0.171) nor between WC-defined groups (with CO = 1.530 (0.764-3.560) vs. without CU = 0.757 (0.469-1.750), p = 0.099). Plasma leptin values were different between hsCRP-defined cardiovascular risk groups (low risk = 0.320 (0.100-0.850) vs. intermediate risk = 0.615 (0.480-1.140) vs. high risk = 3.100 (0.800-5.170) ng/ml, p = 0.011). hsCRP-defined groups did not show sensitivity for other studied parameters. However, hsCRP plasma levels correlated with DBP (ρ = 0.286; p = 0.027), VLDL-C (ρ = 0.276; p = 0.033), TAG (ρ = 0.284; p = 0.028), and leptin (ρ = 0.397; p = 0.011).

Frequency and Immunophenotype of Monocyte Subpopulations in BMI- and WC-defined groups
In the whole population, total monocytes were on average 439 cells/μl (table 1), and were not different in both BMI- (obesity = 446 ± 141 vs. overweight = 445 ± 151 vs. normal weight =422 ± 188 cells /µl, F (2, 60) = 0.121, p = 0.886) and WC-defined groups (with CO = 425 ± 150 vs. without CO 479 ± 174, F (1, 61) = 1.488, p = 0.227). Classical CD16- monocytes accounted for 89% and inflammatory CD16+ monocytes for 11% of total monocytes (table 2). As previously described [14], CD16+ monocytes showed lower cellular complexity/granularity (SSC) and lower expression of CD14, CD36 and CD11b, as compared to CD16- monocytes (table 2). The frequency and the immunophenotype of either CD16+ or CD16- monocytes in BMI-defined groups were similar. However, CD16+ monocytes from CO subjects showed a more inflammatory pattern, with lower SSC and lower expression of CD14 as compared with subjects without CO, as evaluated by the ratio of SSC and CD14 expression on CD16+(p = 0.003) and CD16- monocytes (p = 0.017) in each individual (table 3).

CD16+ Monocytes and Anthropometric and Metabolic/Endocrine Parameters in BMI- and WC-Defined Groups
In the whole sample, plasma levels of AD correlated positively with both CD16+ monocyte size (FSC) and CD14 expression (fig. 2). In BMI-defined obese subjects, CD14 expression was negatively correlated with plasma TC (ρ = -0.764, p = 0.006) and, similarly to whole population, AD was correlated with the FSC of monocytes (ρ = 0.619, p = 0.032).

Correlation between plasma levels of AD and CD14 expression (A) and FSC (B) of CD16+ monocytes. ρ = Correlation coefficients calculated by Spearman test.
Correlation between plasma levels of AD and CD14 expression (A) and FSC (B) of CD16+ monocytes. ρ = Correlation coefficients calculated by Spearman test.
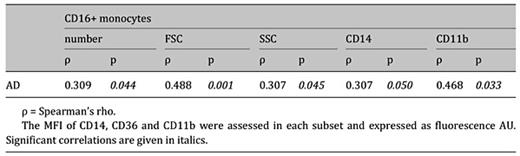
In CO subjects, AD correlated positively with the number and with the immunophenotype characteristics of CD16+ monocytes, namely size (FSC), complexity (SSC) as well as CD14 and CD11b expression (table 4).
Correlation between plasma level of AD and CD16+ monocytes number and phenotype in central obesity
No other associations between anthropometric or metabolic/endocrine parameters, namely leptin, and CD16+ monocyte characteristics (counting and phenotype) were verified.
CD16+ Monocytes and Anthropometric and Metabolic/Endocrine Parameters: Impact of Gender
The female/male ratio was different between CO groups and not verified among BMI groups (table 3). Thus, we analyzed the differences between genders concerning the anthropometric, metabolic and endocrine variables in the whole population (table 1). Relatively to the monocyte subsets, women, comparatively to men, showed lower numbers of CD16- monocytes (women = 343 ± 99 vs. men = 424 ± 149 cells /µl, F (1, 60) = 5.994, p = 0.017) but similar numbers CD16+ monocytes (women = 41 ± 28 vs. men = 61 ± 63 cells/ml, F (1, 60) = 2.529, p = 0.117). The ratio of CD14 expression on CD16+ and CD16- monocytes was lower in females when compared to males (F (1, 60) = 4.953, p = 0.030) (table 1), indicating a more inflammatory pattern of CD16+ monocytes in women. No other differences were noticed between genders in relation to monocyte characteristics.
The number of CD16+ monocytes did not correlate either with the metabolic or the endocrine parameters in both women and men. The plasma levels of LDL-C were found to correlate positively with a more inflammatory phenotype of the CD16+ monocytes in both females and males (SSC: ρ = -0.394, p = 0.042; CD14: ρ = -0.385, p = 0.033). AD, as in whole sample, also correlated positively with CD16+ monocyte size (FSC) in both females (ρ = 0.472, p = 0.013) and males (ρ = 0.405, p = 0.020). In females, AD was correlated with a less inflammatory pattern of CD16+ monocytes: (SSC: ρ = 0.417, p = 0.031); CD14: ρ = 0.411, p = 0.041). On the contrary, in males, AD was inversely correlated with the expression of CD36 (ρ = -0.362, p = 0.038). NA was correlated with a higher inflammatory pattern of the CD16+ monocytes in females (CD11b: ρ = -0.618, p = 0.019), but this correlation was not verified in males.
We performed a multiple linear regression analysis in order to find a predictive model for CO, controlling for gender. The independent variables weight, height, SBP, HDL-C, VLDL-C, TAG, AD, leptin, total number of monocytes, classical monocyte (CD16-) counting ,and CD14 ratio were included in the analysis, as they were significantly different between genders. We found that 33.7% of the CO is explained by a model that includes leptin, CD14 ratio, and VLDL-C (R2 = 0.337; Z = 8.576; df 1; p = 0.006).
Discussion
The main findings of the present study are threefold. First, we identified a prediction model of SIO identified by CO, but not by BMI; CO is predicted in more than one-third with a model that includes the determination of plasma levels of leptin and VLDL-C, and CD14 expression in monocytes subsets. Second, in SIO, CD16+ monocytes showed a ‘more inflammatory' phenotype signature, although no increase in the frequency or absolute number of pro-inflammatory monocytes has been observed, suggesting that the maturation process from classical to pro-inflammatory monocytes already occurs in early stages of inflammatory obesity. Third, CA (AD and NA) were associated with the characteristics of CD16+ monocytes with a putative immunomodulatory role in obesity.
A review of determinants for subclinical inflammation in obesity, namely in children, described a significant increase in C-reactive protein (CRP), interleukin 6 (IL-6), and leptin with increasing adiposity, independent of age [22]. Total dietary fat and percentage of energy from fat were significant predictors of CRP concentration, independently of BMI [6].
Our study demonstrated that leptin and VLDL-C plasma levels as well as CD14 expression on CD16+ monocytes are predictors of inflammatory obesity in a cardiovascular low-risk population. Understanding that more than one-third of inflammatory obesity is explained by these parameters, this data may contribute to clarify why the adiposity measurements (general and/or central) per se fail in prediction of CVD [22]. The interpretation of the results from a collaborative analysis of 58 prospective studies was that measures of general obesity and CO did not improve CVD risk assessment when information is available on SBP, diabetes, and lipids [23]. Moreover, it is widely accepted that the cluster metabolic syndrome is explained by underlying inflammation the trigger of which is not completely understood. Our model predicts obesity-associated inflammation. Leptin plays a main inflammatory/immunomodulatory role [24], and increased levels of VLDL-C are one of the first events of dyslipidemia associated to obesity [25]. In addition, the more inflammatory pattern observed on CD16+ monocytes from CO subjects may facilitate their transmigration to AT and subsequent local inflammation. Prospective studies would be necessary to evaluate our predictive model of inflammatory obesity in CVD risk assessment.
In the present work, a cardiovascular low-risk population was recruited to study SIO. CO was associated with dyslipidemia and a distinct phenotypic inflammatory pattern of CD16+ monocytes (with no expansion), while no significant differences were noticed between BMI groups. Using a flow cytometric approach, we differentiated two monocyte subsets as described before [13]: classical CD16- monocytes and non-classical CD16+ monocytes (with lower SSC and lower expression of CD14, CD36, and CD11b in comparison to classical monocytes). Although an intermediate subset of CD16+ monocytes has been reported [26], which shares the gene expression profile [27] and a higher expression of CD14 [26] with the classical subset, its biological role remains unclear. This intermediate subset that in physiological states constitutes a very small percentage in circulation seems to represent a transitional maturation stage from CD16- to CD16+ monocytes [26]. Moreover, it has been demonstrated that non-classical monocytes (and not the intermediate monocytes) are the primary inflammatory monocytes in acute and chronic inflammatory conditions [28]. Our findings, showing an association between CO and a subset of CD16+ cells with lower expression of CD14, would suggest that CD16+ monocytes more likely belong to the non-classical subset.
According to our results, several studies in human chronic pathologies associated with low-grade inflammation did not find changes in CD16+ monocyte counts [29,30,31]. In contrast, Rogacev et al. [16] have shown a weak correlation between BMI and CD16+ monocyte counts (total CD16+ and intermediate, but not non-classical monocyte subsets). Curiously enough, Berg et al. [32] showed that elevated numbers of CD16- monocytes predicted cardiovascular events, independent of gender, age, current smoking, HDL-C , and the presence of diabetes and hypertension.
The expression of adhesion molecules (CD11b) [33] and scavenger receptors (CD36) [34] in peripheral blood monocytes have been used to characterize the inflammatory response in metabolic disorders because of their involvement in the pathogenesis of diabetes and obesity [35,36]. CD11b has been associated with high-fat diet-induced obesity [37], and carotid intima-media thickness [38], and CD11b expression was described as lowest for non-classical monocytes after lipopolysaccharide stimulation [39] and in a rodent model of type 2 diabetes [40]. Results concerning CD36 atherogenicity are also contradictory since an increase [35] or deficiency [41] of its expression have been associated with the pathogenesis of atherosclerosis and CVD.
These contradictory results relatively to monocyte subset characteristics (counting and phenotype) may be explained by discrepancies in gating strategies for flow cytometric characterization and purification protocols contributing to significant changes in receptor expression. We have adopted whole blood and staining protocol to perform the flow cytometric study in a robust gating strategy.
Circulating monocytes undergo phenotypic modifications due to exposure to systemic environmental factors [2]. Plasma lipids and leptin are immune modulators [2,24], and they could have affected the phenotype of CD16+ monocytes. Circulating lipids may also influence the function of the immune cells [2]. Despite the regulatory role of leptin on human monocytes [42], it seems unlikely that this adipokine could be the only factor explaining the more inflammatory pattern observed on CD16+ monocytes from CO subjects, as its levels were also elevated in the generally obese. On the other hand, individuals with CO showed significantly higher levels of TAG, TC, and VLDL-C compared to those without CO. Furthermore, BMI, frequently associated with dyslipidemia [1], was not sensitive for differences in lipid plasmatic profile. Apart from the fact that BMI-defined obesity has missed the detection of subclinical inflammation in our study, it has also been reported that visceral fat measurements elucidate relationships between obesity and cancer otherwise not significant when evaluated by BMI [43].
CD16+ monocytes seem to reside in a marginal pool mobilized by a CA-dependent pathway [44]. In CO, AD was correlated with number and size and with a lower inflammatory pattern of CD16+ monocytes. This suggests that AD is associated with the expansion of this monocyte subset, as already described in stressful conditions such as coronary artery disease [45], but with a less inflammatory phenotype, ias described by Takahashi et al. [46]. Our work also suggests that CA such as AD and NA have an immunomodulatory role in obesity. The adrenergic regulation of human monocytes was recently reviewed [47]. On human monocytes, even if under certain conditions pro-inflammatory responses may arise, the predominant view is that β-adrenoceptor (β-AR) activation is usually anti-inflammatory and immunosuppressive. In this context, the putative immune effects of β-AR agonists in CO requires further investigation.
Usually correlated with adiposity [48], hsCRP was not a useful marker for SIO in our population with low cardiovascular risk. Others have also described a non-linear relation between hsCRP concentration and adiposity [49]. Although we have found an association between hsCRP and DBP, VLDL-C, TAG or leptin, the cardiovascular risk groups defined by hsCRP only differentiated plasma levels of leptin. Indeed, leptin may mediate the relation between hsCRP and obesity [49].
Our study describes a stronger association of inflammation and obesity in females, which is in line with the results of Thorand et al. [50]. Indeed, women showed higher levels of leptin usually associated with inflammatory immune responses [24]. Moreover, CA behave differently by gender [51]. AD plasma levels were associated with a less pro-inflammatory CD16+ monocyte phenotype in females and with a higher level of inflammation in males. In opposite, NA was associated with a higher inflammatory phenotype only in females. These data could be explained by a higher percentage of adiposity in females and differences in endogeneous hormones.
Our work suggests that in SIO, dyslipidemia and leptin could induce a monocyte maturation process rather than an independent rise of CD16+ monocytes. Moreover, our model, explaining a significant part of CO, can be an important tool for early therapeutic interventions to reduce health risks associated to obesity.
In a cardiovascular low-risk population, those with central, but not with general, adiposity wee sensitive to metabolic risk factors and to a more pro-inflammatory pattern of CD16+ monocytes (reflecting a higher activation of the innate immune system). Our findings point to the need to further investigate the phenotypic pattern of circulating monocytes in an early phase of CO and its relation with migratory and inflammatory functions.
Conclusions
CO, but not general obesity, is associated with subclinical inflammation. A model that includes the determination of plasma leptin and VLDL-C levels and CD14 expression in monocyte subsets predicts and explains a significant part of CO. Our work suggests that in SIO dyslipidemia and leptin induce a monocyte maturation process, rather than an independent rise of CD16+ monocytes, and also suggests CA (AD, NA) immunomodulation in obesity. The stronger association found between CO and cardiometabolic risk factors in comparison with that between general obesity assessed by BMI and these risk factors demonstrates that WC measurement should be used as priority tool for the screening of inflammation in populations with low cardiovascular risk.
Acknowledgments
The authors are grateful to Ana Ramires, PhD, (Research Unit on Governance, Competitiveness and Public Policy (GOVCOPP), University of Aveiro, Portugal) for her criticism.
Financial Support
This work was supported by FCT funding UID/BIM/04293/2013 and Pest-OE/SAU/UI0215/2014 - Unidade Multidisciplinar de Investigação Biomédica-UMIB/ICBAS/UP.
Disclosure Statement
The authors declare to disclose all financial and commercial conflicts of interest.
All authors have read the journal's authorship agreement and policy on disclosure of potential conflicts of interest.
All authors approved the final manuscript.

